Turn survey responses into
clear product signals
Track NPS, CSAT, response rates, and per-question breakdowns in the analytics dashboard. Then use response tags, AI auto-tagging, and sentiment to understand the open-text feedback behind the charts.
No credit card required · Real-time from day one
No MAU limits · No response caps · Survey dashboards, response tags, and sentiment
Analytics for the score,
and the words behind it
Pulseahead keeps the quantitative dashboards SaaS teams expect, then adds the structure needed to review open-ended feedback at volume.
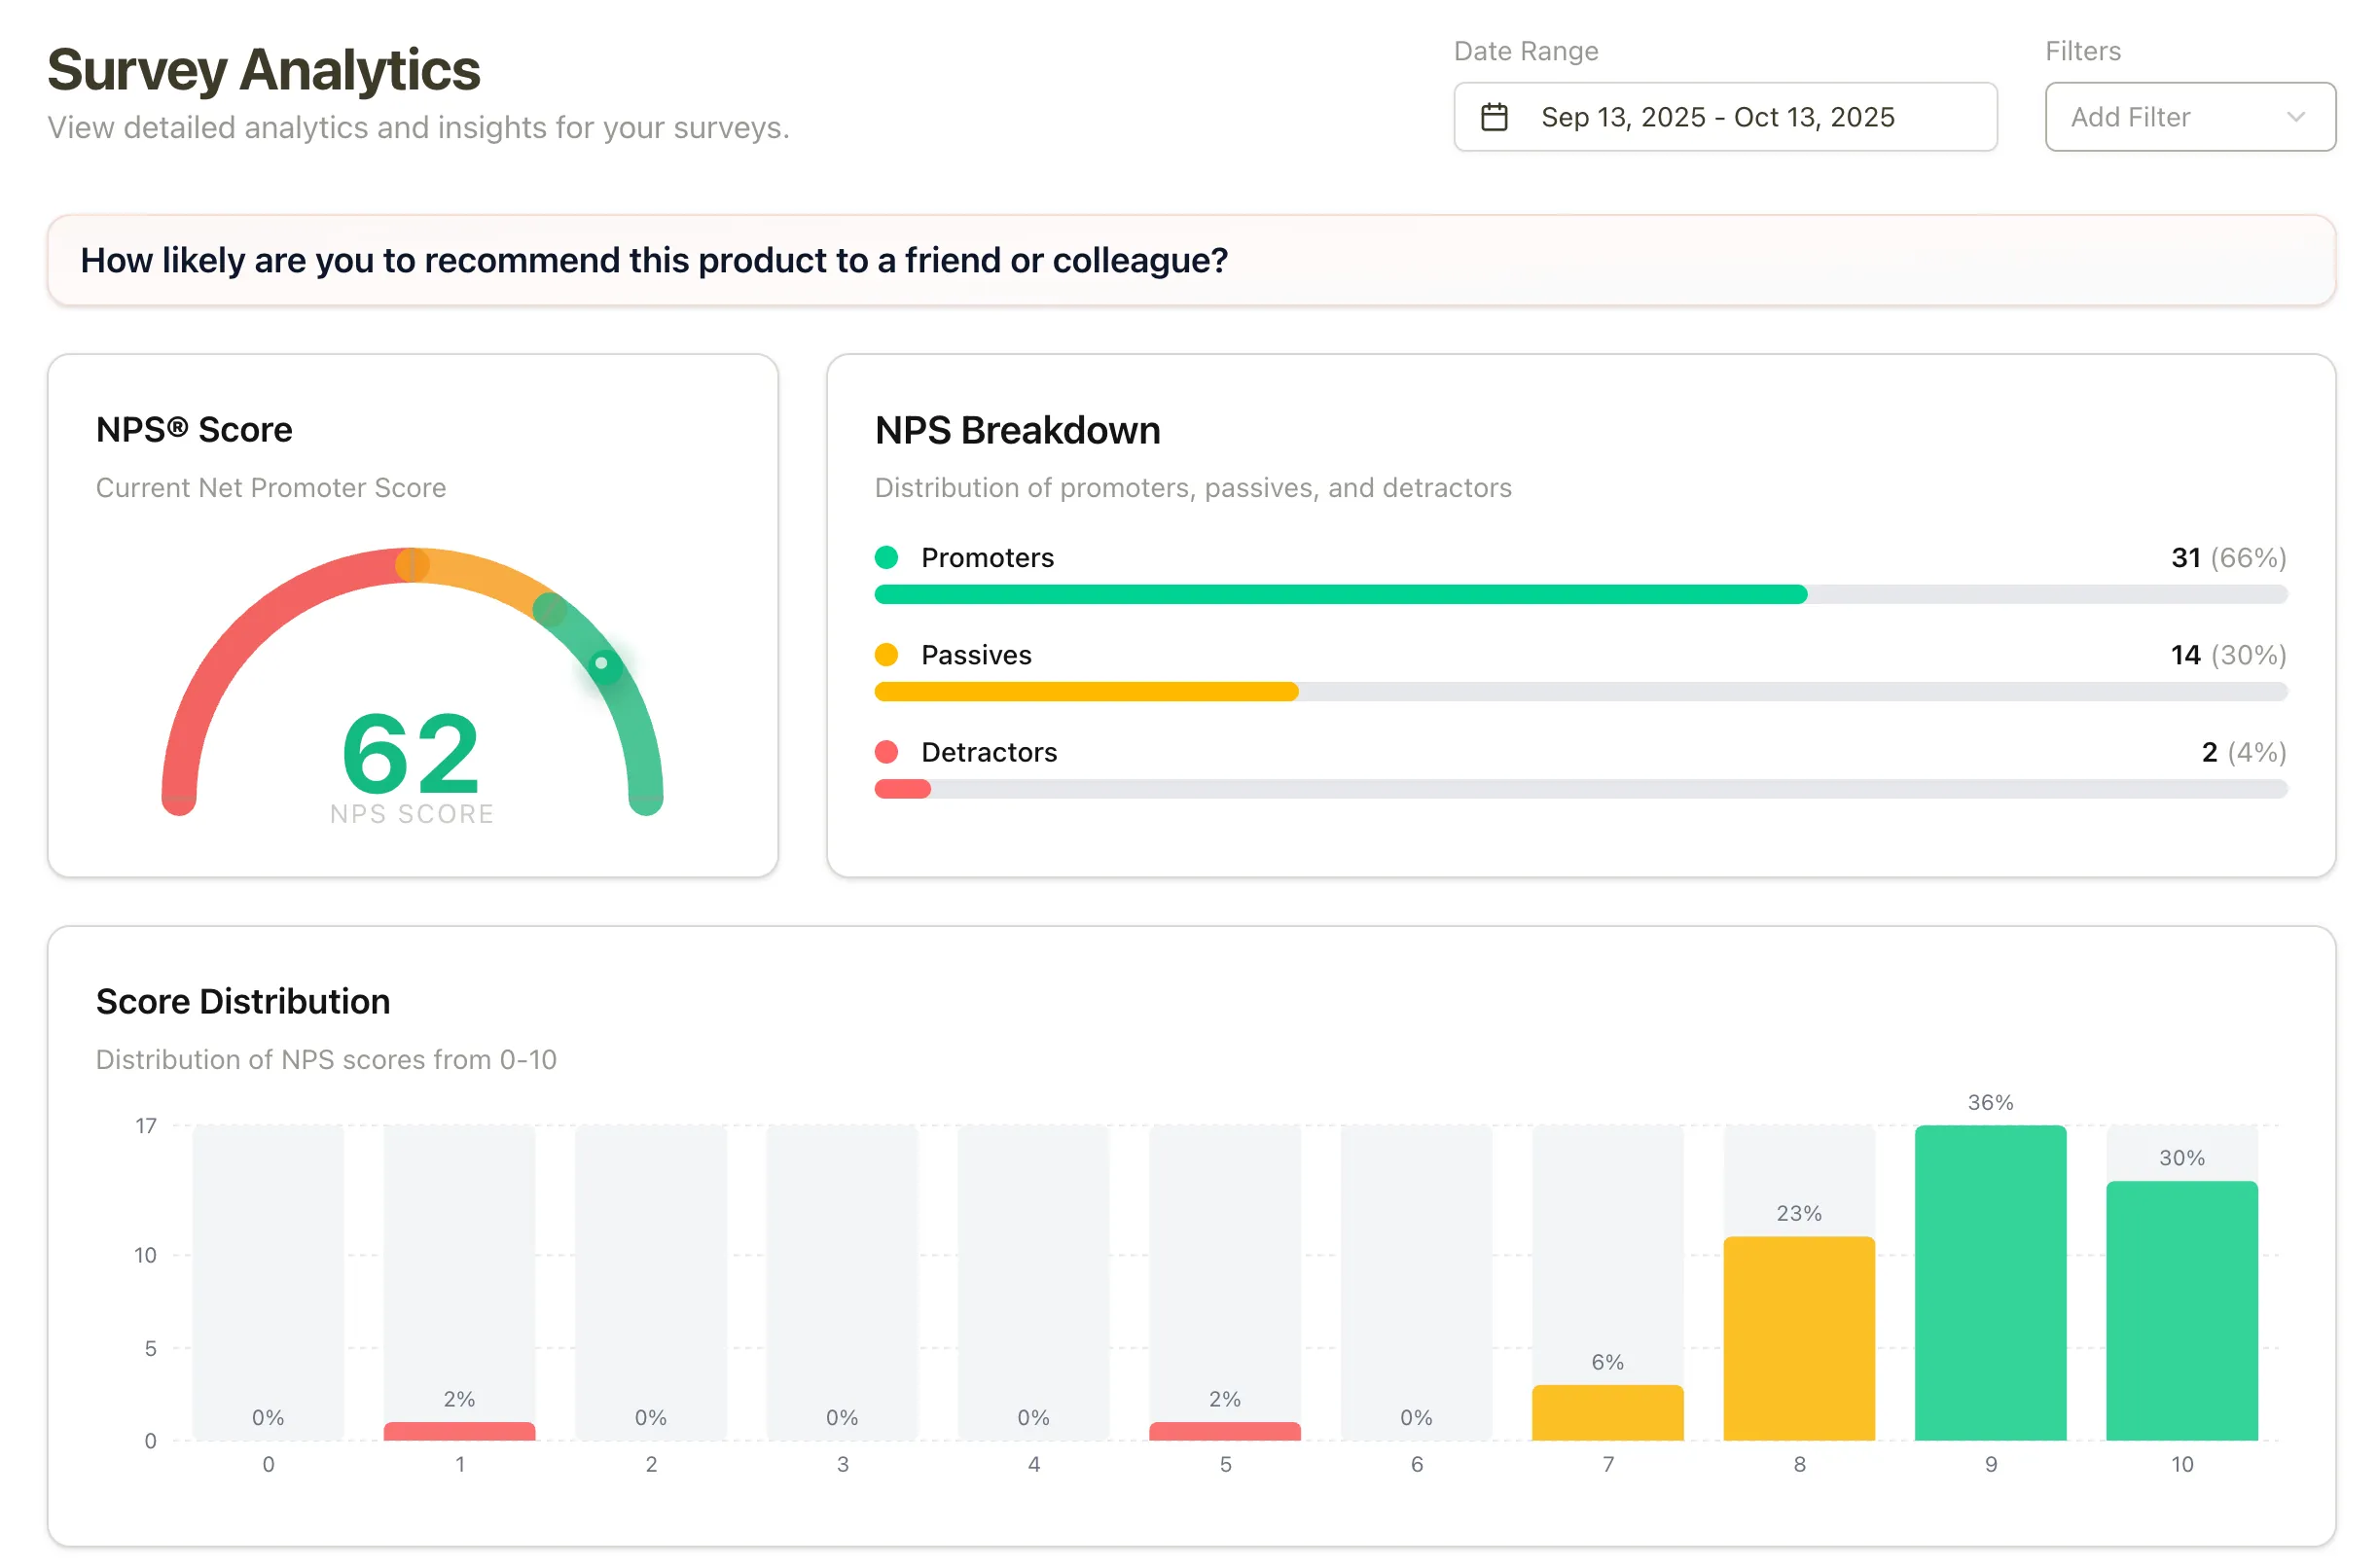
- NPS trend chartScore over time with promoter, passive, and detractor breakdowns
- CSAT trendsTrack satisfaction and effort scores by survey period
- Score distributionSee the spread of scores, not just the average
- Response rate by surveyMonitor completion rates and response volume over time
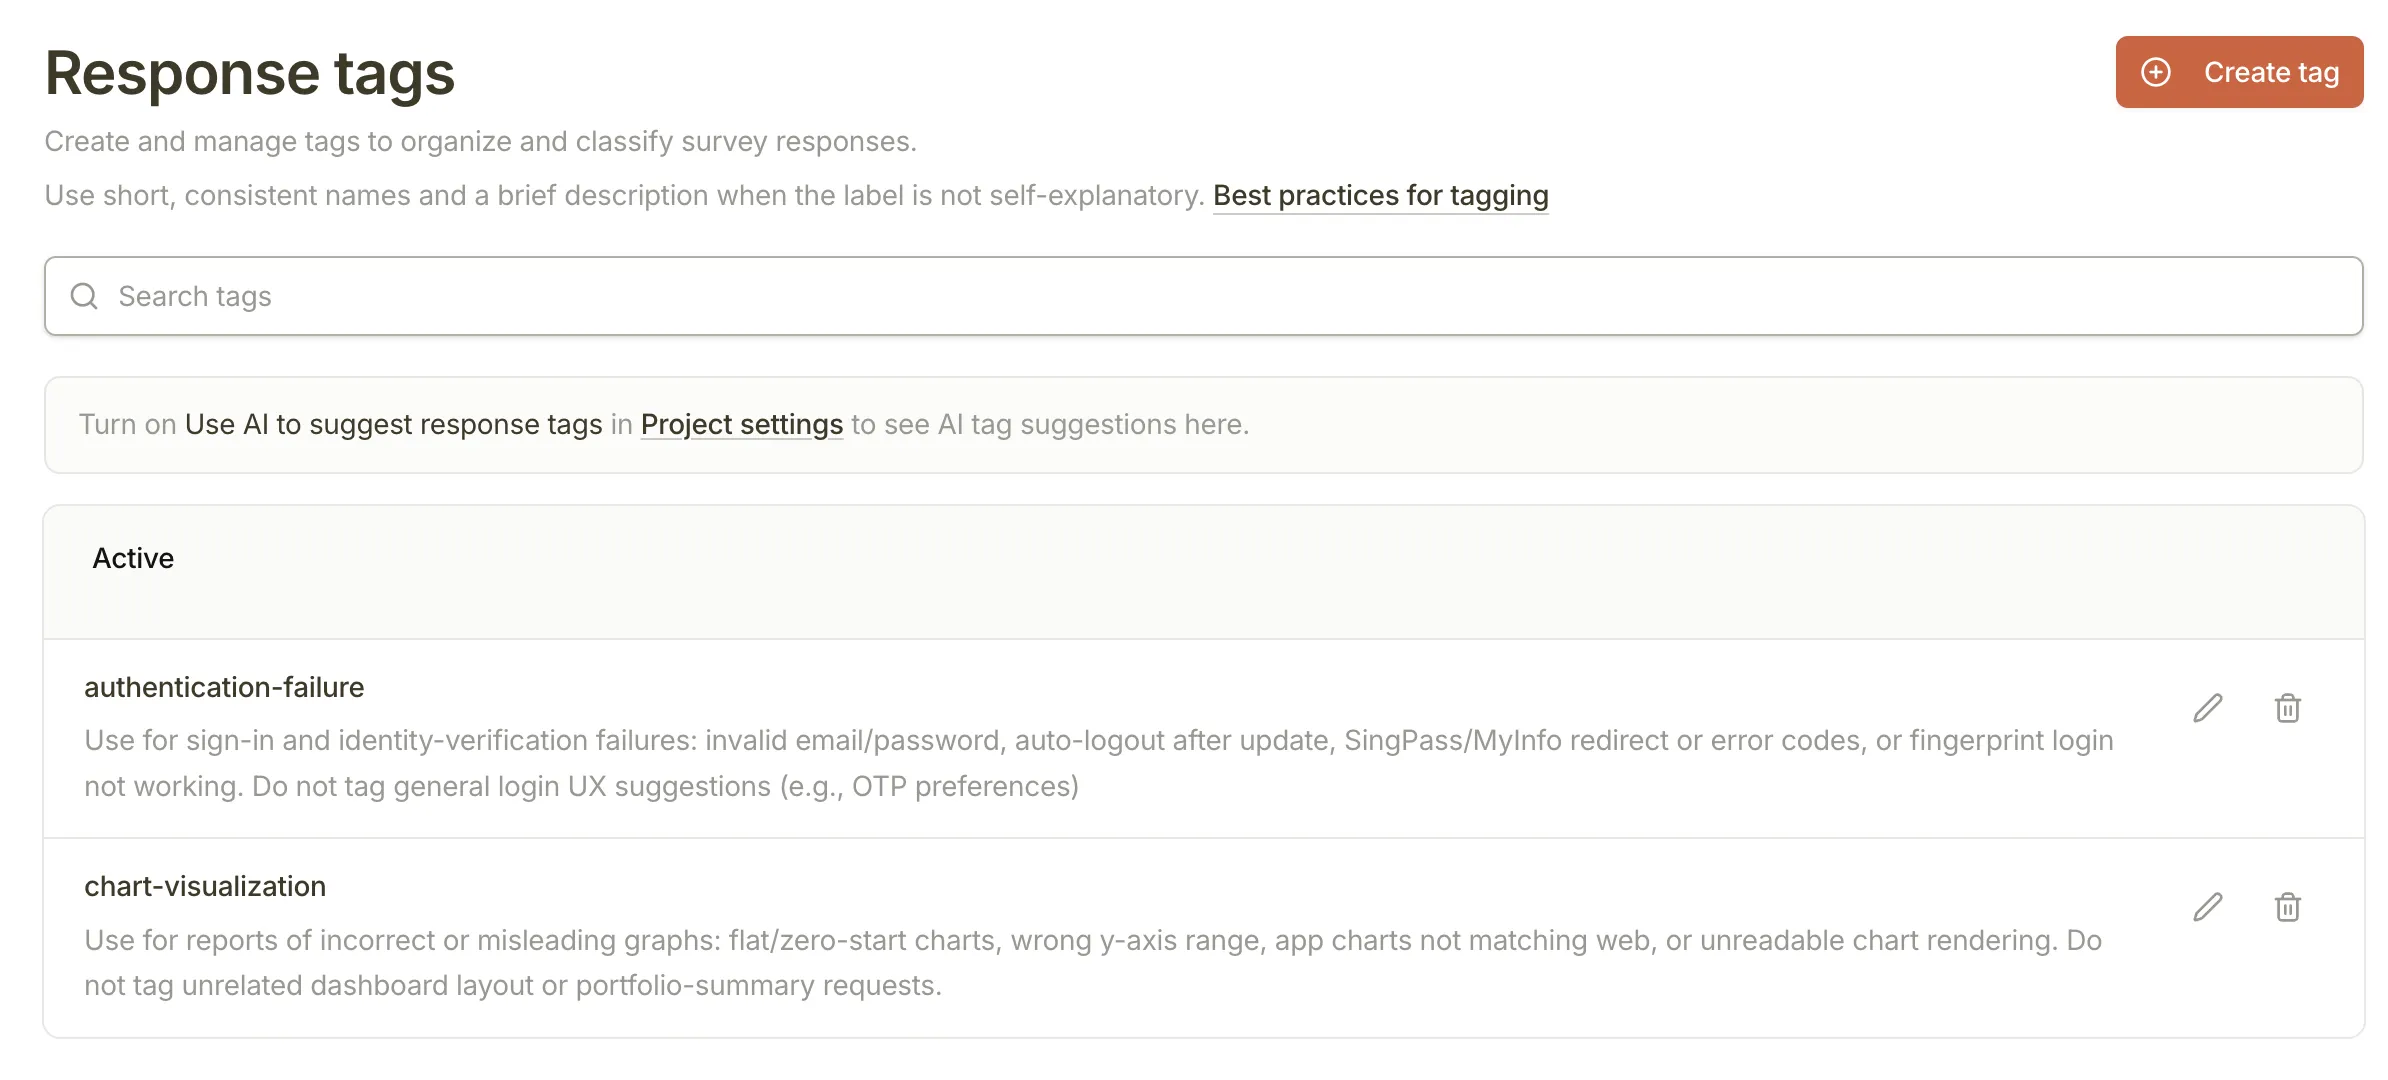
- Response tagsCreate a shared vocabulary for themes like pricing, bugs, and onboarding
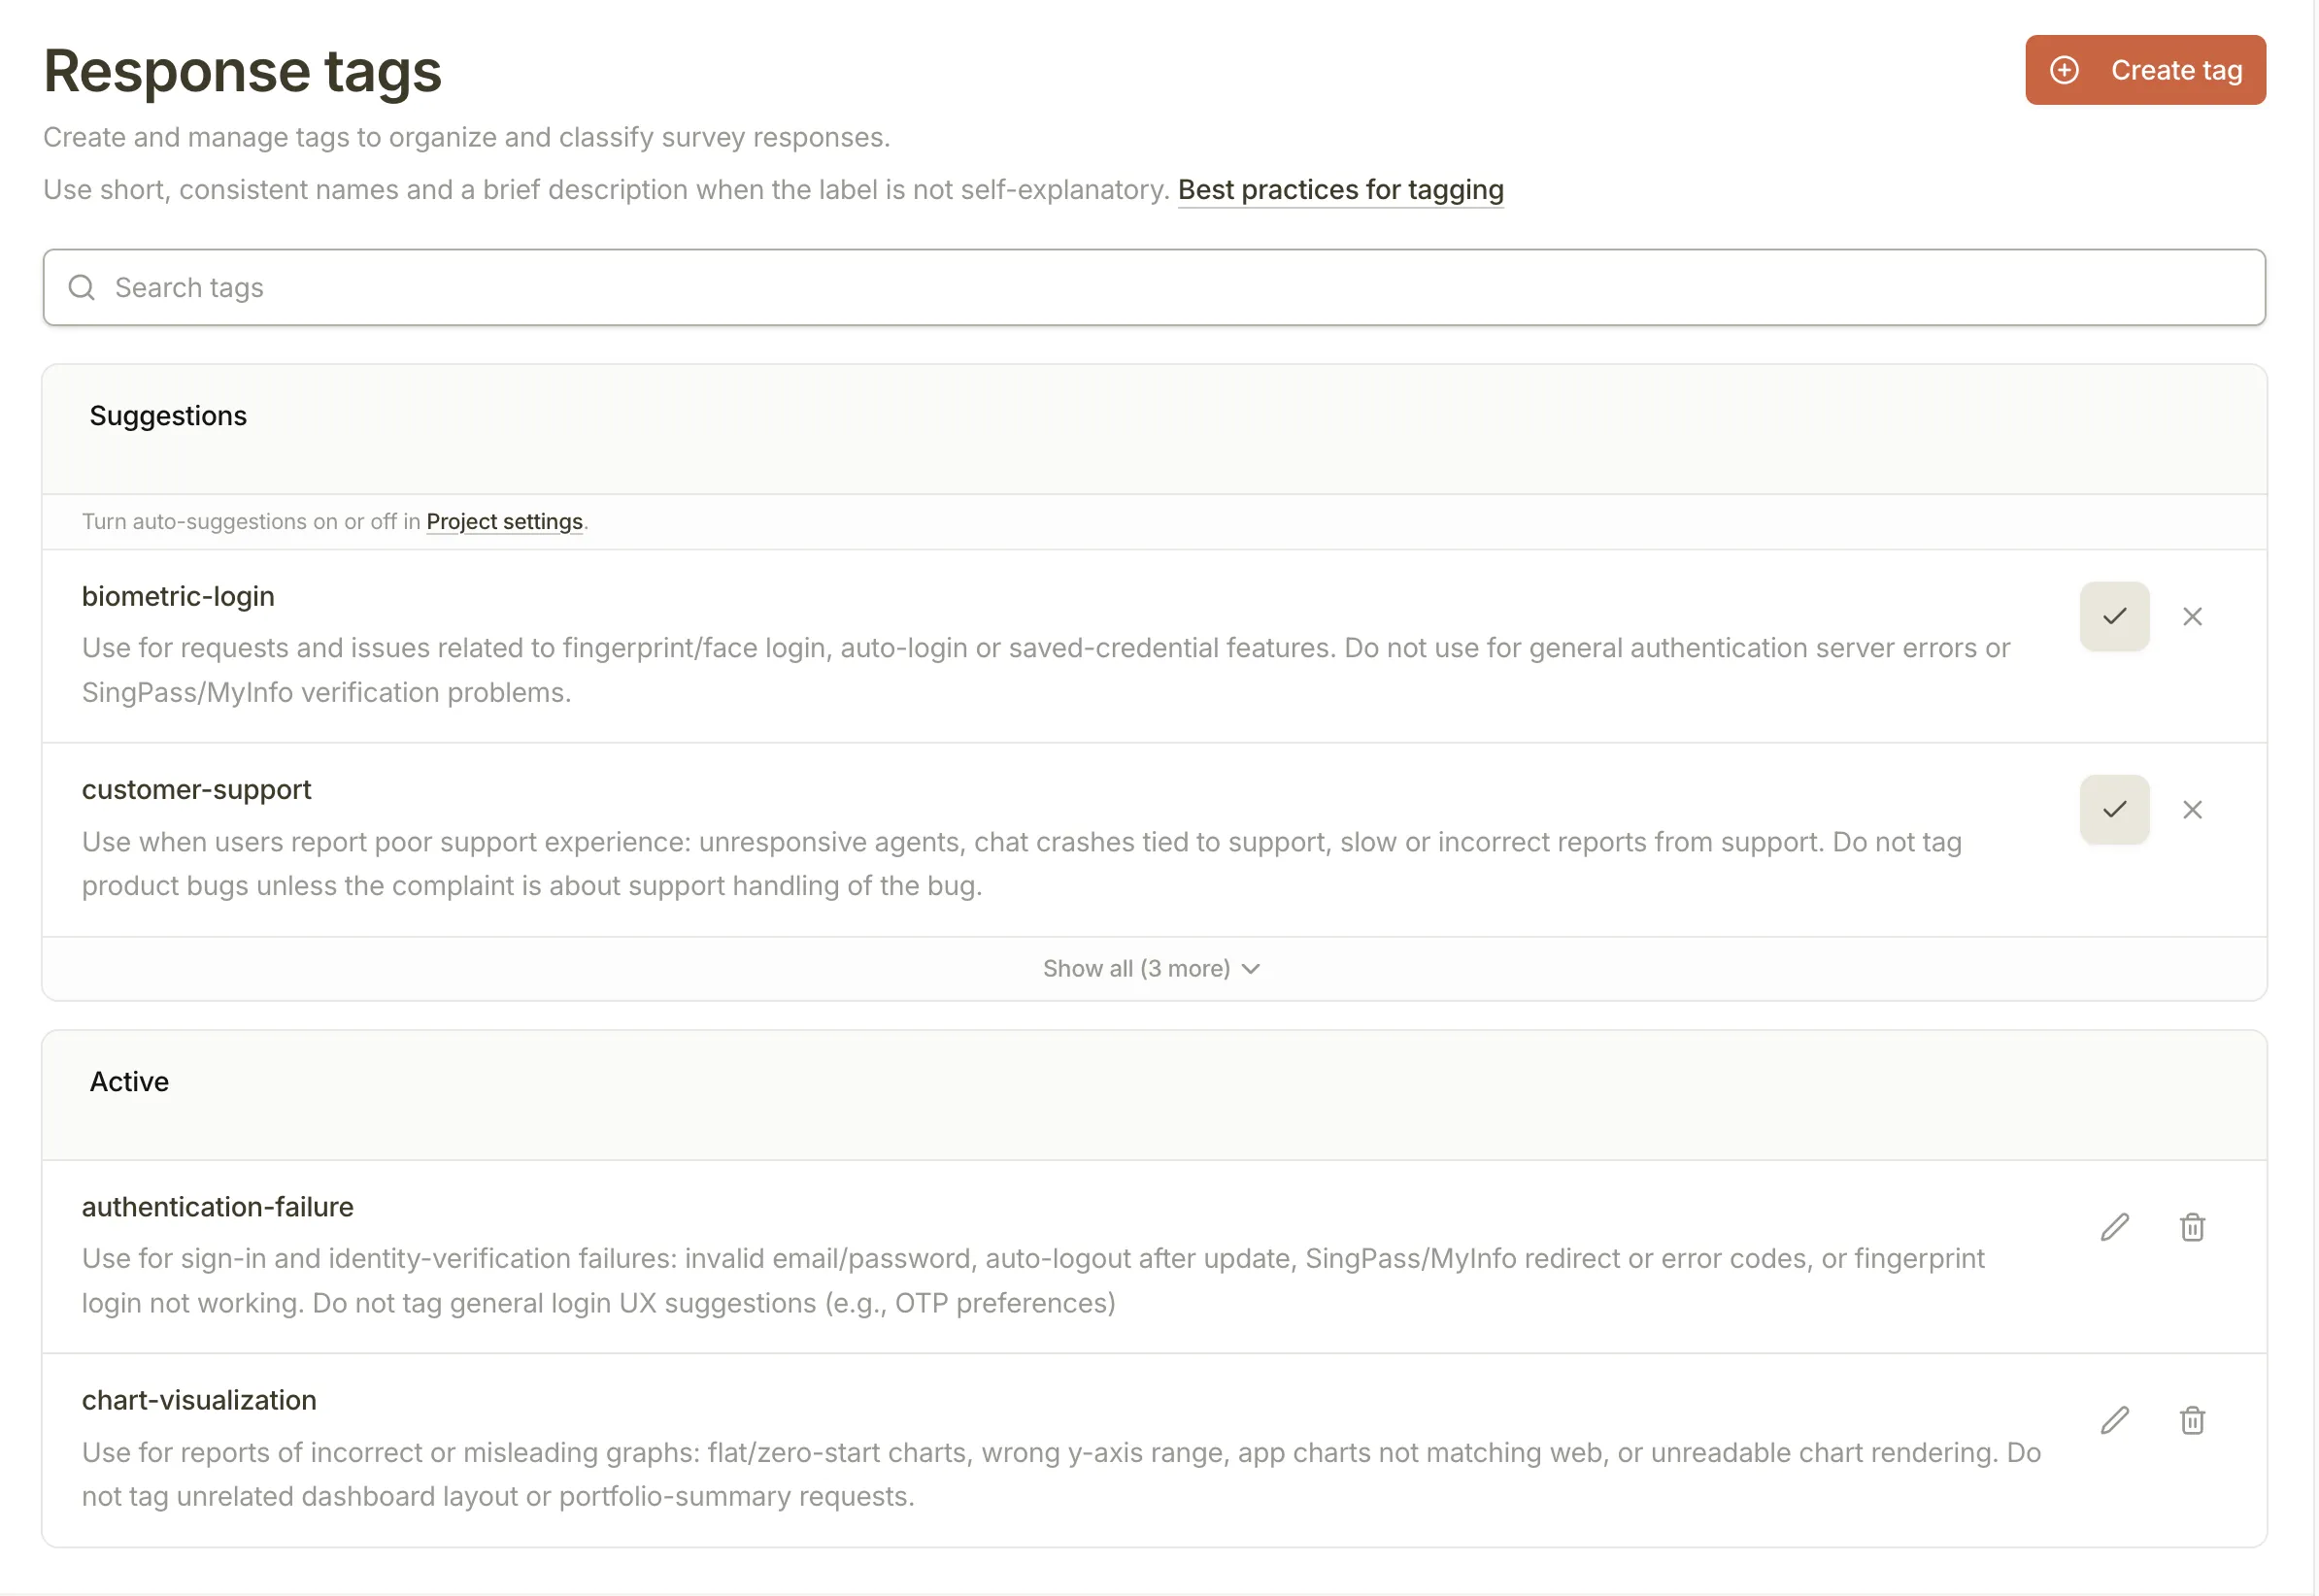
- AI tag suggestionsReview suggested tags from recent open-text answers before accepting them
- AI auto-taggingApply approved tags to new open-text responses when there is a clear match
- Sentiment labelsSeparate positive, neutral, negative, and unprocessed written feedback
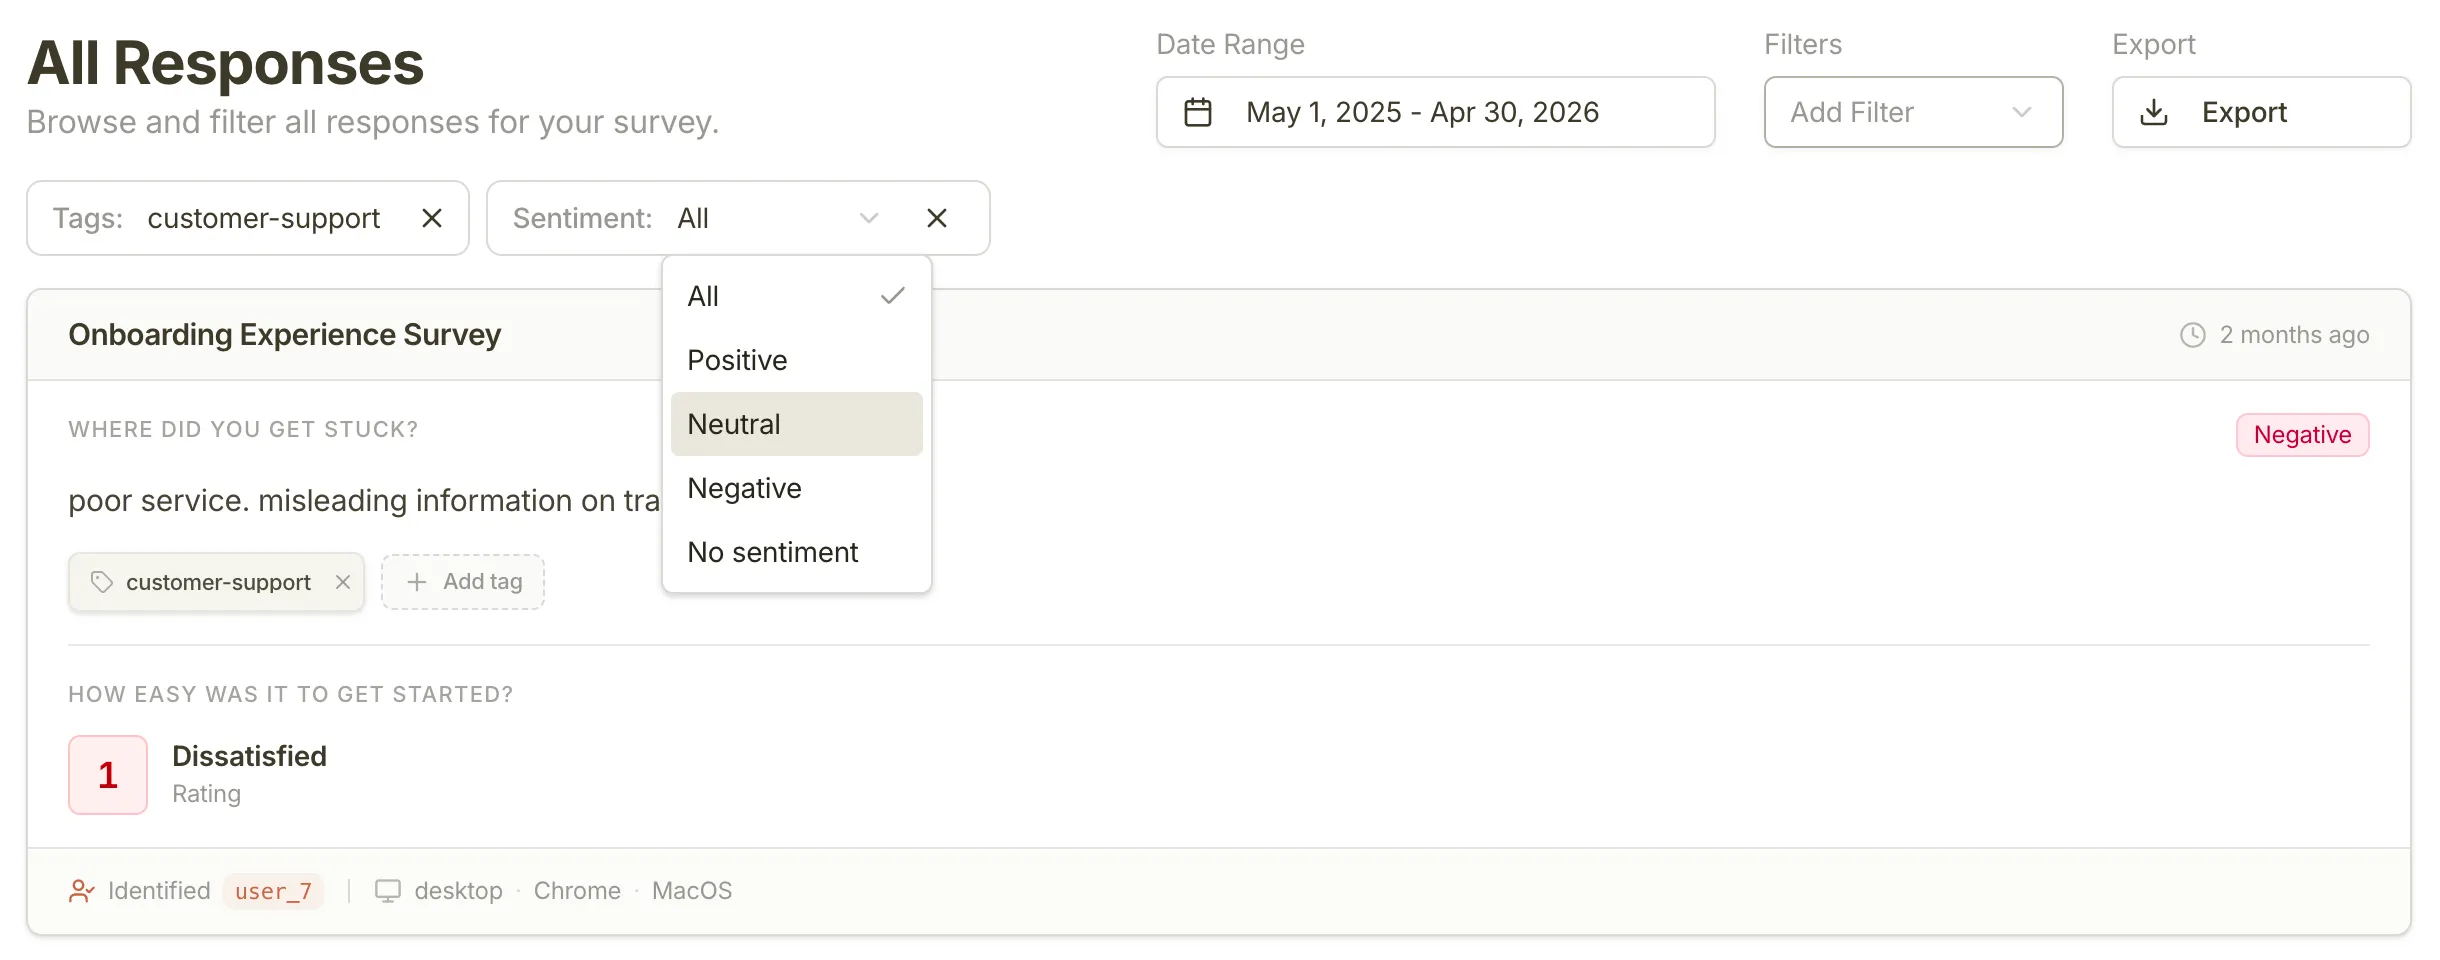
- Tag and sentiment filtersFind negative feedback, feature requests, or untagged answers faster
- Real-time response feedReview every submission as it arrives, with user context when available
- User response historySee all responses from one identified user across surveys
- CSV exportDownload datasets for deeper analysis in spreadsheets or BI tools
Charts and trends still do the
first layer of analysis
Product teams need the dashboard view before they dive into individual comments. Pulseahead shows the score, the distribution, the response trend, and the user context so you can see whether a feedback pattern is actually moving.
See how scores move after launches, experiments, or onboarding changes
Track NPS, CSAT, ratings, response rates, and score distributions over time so your team can separate one-off comments from real movement.
Every step gets the right breakdown
NPS shows promoters and detractors. Choice questions show option share. Ratings show distribution. Long text keeps the original answers close to the chart.
Connect feedback back to the user who gave it
When you pass your own user ID through the SDK, Pulseahead shows the response history behind the metric instead of leaving you with anonymous averages.
Stop treating written feedback
like an endless inbox
Long-text answers are where users explain why activation is stuck, why pricing feels wrong, or what would make them stay. Tags and sentiment make those answers easier to review without flattening the context.
Create a tag system your team can actually use
Turn messy open-text answers into clear themes like pricing, bugs, onboarding friction, or feature requests. PMs, researchers, founders, and growth teams can review feedback with the same language.
Start with suggested tags, then keep control
Pulseahead reviews recent open-text answers and suggests tags for recurring themes. Suggestions stay separate until you accept them, so AI helps you avoid blank-page tagging without taking over your taxonomy.
Filter by theme, sentiment, or what still needs review
Use tags and sentiment to get straight to the feedback that matters: negative onboarding comments, pricing objections, upgrade blockers, positive proof points, or untagged answers that need a human pass.
From raw answers to review-ready signals
The workflow stays simple: ask the question, define the themes, let Pulseahead handle the obvious labeling, then focus your review on what needs a decision.
Collect open-text feedback
Ask users what blocked activation, why they churned, what confused them, or what would make them upgrade.
Create or accept tags
Build your own tag set or review AI suggestions based on recent answers from your project.
Let AI apply obvious labels
Approved tags and sentiment are applied to new open-text answers when Pulseahead has enough confidence.
Filter the feed and analytics
Move from reading every answer to reviewing the themes, tones, and users that need action first.
Find the themes hiding in your feedback.
Then decide what needs action.
Use response trends, tags, sentiment, and user context to move from a pile of answers to a clearer product, research, or growth decision.
Common Questions
Everything you need to know about feedback analytics in Pulseahead.
Are response tags manual or AI-assisted?
Both. You can create and apply tags yourself in the response feed. Pulseahead can also suggest new tags from recent open-text answers and apply approved tags to new responses when there is a clear match.
Does AI create tags automatically?
No. Suggested tags stay separate until you accept them. Auto-tagging uses tags your team has already approved, so Pulseahead helps with the repetitive labeling without changing your taxonomy on its own.
How does sentiment work?
Sentiment is applied to long-text answers as positive, neutral, or negative when AI auto-tagging is enabled. Responses can also show no sentiment when they have not been processed yet or when confidence is too low.
How do tag and sentiment filters help my team?
They let you narrow the response feed and survey analytics to what matters right now. PMs can review feature requests, researchers can scan recurring pain points, founders can find churn risk, and growth teams can isolate upgrade or pricing blockers.
Can I still see NPS, CSAT, and per-question breakdowns?
Yes. Pulseahead still shows score trends, distributions, response rates, and per-question analytics. Tags and sentiment add structure to the written feedback behind those metrics.
Can I export data for custom analysis?
Yes. CSV export is available on all plans, allowing you to download any response dataset for analysis in your own BI tools, spreadsheets, or data warehouses.