You’ve probably seen the 18% figure. It’s the most-cited benchmark for SaaS free trial to paid conversion, coming from a 2025 First Page Sage study. While that number is real for trials requiring no credit card, it remains incomplete.
That 2025 study included 86 companies. A newer 2026 study from ChartMogul of 200 products reveals different averages: opt-in trials actually convert at 8.9%, while CC-required trials hit 31.4%. If you don’t know which study or model your benchmark comes from, you’re comparing your product to a number that may not apply at all.
Measuring trial-to-paid conversion in isolation ignores the visitor-to-trial signup rate, which ultimately dictates your net revenue impact. To provide the complete picture, the tables below break down the full funnel data from both studies. This article also lays out benchmarks by trial type, vertical, and company stage. It covers what your conversion rate is telling you about revenue, how to set up tracking that catches problems early, and what teams consistently hitting 25%+ do differently.
The famous 18% benchmark comes from a smaller 2025 study. A larger 2026 dataset shows significantly lower averages. Your true benchmark depends entirely on your specific market and trial model.
- Opt-in free trials (no CC) average 18.2% in the 2025 study, but only 8.9% in the 2026 data.
- Opt-out free trials (CC required) average 48.8% (2025) and 31.4% (2026). This model produces nearly 3x more paying customers from the same traffic.
- 1 percentage point improvement in conversion produces roughly 15% more new revenue per trial cohort.
- Day 7 is everything. Most B2B conversions happen when the trial expires. After day 14, rates drop to ~1%.
- The fastest path to better conversion is not a product change. It’s faster time to value in the first 7 days.
What the 18% Benchmark Actually Means
18% is not the universal SaaS free trial conversion rate. Its a factor of industry you operate in and the trial model you offer. That distinction changes everything when you’re trying to benchmark your product.
Understanding the Two Key Studies
When comparing your conversion rates, it is critical to understand the source of the data. The benchmarks most often cited come from two major studies:
- The 2025 Study (First Page Sage): Analyzed 86 companies with a mix of 71% B2B and 29% B2C products. This dataset produced the widely cited 18.2% average for opt-in trials.
- The 2026 Study (ChartMogul): Analyzed 200 software products, where 22% of the products were either mostly B2C or a hybrid of B2C and B2B. This dataset revealed significantly different average conversion rates (e.g., an 8.9% average for opt-in trials).
According to First Page Sage, conversion rates look very different depending on trial model and traffic source:
| Trial Model | Visitor to Signup | Signup to Paid | Paying Customers per 1k Visitors |
|---|---|---|---|
| Opt-in free trial (no CC) | 8.5% | 18.2% | 15.5 |
| Opt-out free trial (CC required) | 2.5% | 48.8% | 12.2 |
| Freemium | 13.3% | 2.6% | 3.5 |
| Trial Model | Visitor to Signup | Signup to Paid | Paying Customers per 1k Visitors |
|---|---|---|---|
| Opt-in free trial (no CC) | 7.1% | 17.4% | 12.4 |
| Opt-out free trial (CC required) | 2.2% | 51.0% | 11.2 |
| Freemium | 15.9% | 2.8% | 4.5 |
The opt-out number looks dramatically better. It is. But fewer prospects enter the trial in the first place, because asking for a credit card is a genuine barrier. The net outcome from a 2026 ChartMogul study of 200 products tells the fuller story:
| Trial Model | Visitor to Signup | Signup to Paid | Paying Customers per 1k Visitors |
|---|---|---|---|
| Opt-in free trial (no CC) | 4.5% | 8.9% | 4.0 |
| Opt-out free trial (CC required) | 3.5% | 31.4% | 11.0 |
| Freemium | 9.0% | 5.6% | 5.0 |
| Ungated freemium | 7.0% | 8.0% | 5.6 |
How Conversion Varies by Vertical
Product category shapes conversion almost as much as trial structure. First Page Sage’s 2025 data shows complex sales cycles drag down both ends of the funnel.
Enterprise and fintech products see the lowest trial-to-paid conversion (18-19%), while CRM and education convert significantly better (25-29%). However, measuring trial-to-paid in isolation hides the full revenue impact.
Looking at paid users acquired per 1,000 website visitors widens the gap. Enterprise software suffers a severe top-of-funnel bottleneck, only 5.5% start a trial. Combined with low backend conversion, enterprise companies yield just 10 paid customers per 1,000 visitors. Heavy B2B categories requiring security reviews face similar struggles.
Meanwhile, CRM yields 28 paid users per 1,000 visitors, driven by its category-leading 29% conversion rate. Lighter deployments like healthcare and education also leverage high engagement to acquire 25-26 paying customers.
(Note: The study included any industry with at least five clients, so niche category averages may be skewed.)
Vertical dictates conversion potential because it dictates evaluation effort. Products requiring committee approval will never achieve high signup volume, leaving backend conversion optimization as the only path forward.
Why Averages Hide the Real Story
The numbers in both tables above are averages. When benchmarking your product, averages often paint a misleading picture because outliers pull the numbers in extreme directions.
Instead of measuring against a distorted mean, look at where you actually stand: good vs. great. That breakdown uses the 2026 study to set realistic benchmarks, defining “good” as the 50th percentile and “great” as the 75th percentile for your specific trial model.
Where You Actually Stand: Good vs. Great
The median free-to-paid conversion across 200 products in 2026 was 8%, from ChartMogul’s Conversion Report. But almost nobody actually has an 8% rate. The distribution is bimodal: you’re either in the low single digits or above 15%. Very few products cluster at the median.
Here’s what good and great look like by model, defining “good” as the 50th percentile and “great” as the 75th percentile from the 2026 dataset:
| Trial Model | Good | Great |
|---|---|---|
| Opt-in free trial (no CC) | 4-6% | 10-15% |
| Opt-out free trial (CC required) | 25-35% | 50-60% |
| Freemium | 3-5% | 8-12% |
| Ungated freemium | 7-9% | - |
| AI-native / hybrid | 6-8% | 15-20% |
For opt-in B2B specifically: 15% is acceptable, 25% is the target, 30%+ is excellent. Lincoln Murphy’s benchmarks from Sixteenventures are a useful anchor: below 25% on opt-in means conversion optimization should be the top priority. Above 25%, the bigger gains usually come from better-qualified acquisition, not further conversion tweaks.
What the Distribution Actually Tells You
One-in-five B2B free trial products converts below 2.5%. Thirty percent sit between 2.5% and 7.5%. Twenty-three percent convert above 25%. The spread between the bottom and top quartile is enormous. Knowing which cluster you’re in is more useful than comparing against the median.
If you’re in a new B2B product with an opt-in trial, 15-30% is a reasonable target. Don’t anchor to the 8% median. That number includes every poorly-run trial in the dataset.
How Trial Conversion Rate Affects Your Revenue
A 1 percentage point improvement in free-to-paid conversion produces roughly 15% more new revenue per trial cohort, per ChartMogul’s analysis of 200 products. One point. Fifteen percent more revenue. Without touching pricing, product, or acquisition spend.
500 trials at 10% conversion generates 50 customers. At 15%, you have 75. That’s a 50% increase in paying customers from the same signups. And unlike paid acquisition wins, this compounds. Every future cohort benefits from the same improvement.
The reverse is equally true. If you’re sitting at 5% when your model’s benchmark is 18%, you’re leaving roughly two-thirds of your potential revenue on the table every month.
43% of B2B products improved free-to-paid conversion over the past 12 months, per ChartMogul’s 2026 survey. Most saw 10-25% gains. 1 in 10 improved by more than 25%. The upside is real and available to most teams.
Why Most Trials Fail to Convert
The first is a missing aha moment. Users sign up, explore, and never reach the point where the product clicks. Data shows users who interact with core features in their first three days convert at 4x the rate of those who don’t. If your product requires significant setup before showing results, most users abandon before that moment arrives.
Slow time-to-value is the second cause. The conversion cliff happens earlier than most founders expect. Research from ProductLed suggests the critical window can be as short as 7 minutes into the first session. Every required setup step, every form field, every wizard that delays the core product experience compounds abandonment.
Onboarding friction create silent drop-offs. An onboarding completion survey can surface exactly which steps users find confusing. Users who complete an onboarding flow are 5x more likely to convert, per Intercom’s research on activation patterns. Most onboarding flows are designed to collect information rather than create an early win. Reducing your signup form from 15 fields to 3 is a revenue decision more than a design one.
The fourth cause is hiding core features behind a paywall. When the most compelling features sit behind the paid tier, trial users never see what justifies the price. Without the ability to evaluate the full experience, they simply won’t buy it.
Day 7 Is Your Only Real Conversion Window
ChartMogul analyzed trial-to-paid conversion timing across 2,500 companies. The median daily conversion rate sits near zero every day of the trial except the last. Users don’t convert on day 3 or day 10. They convert when the trial expires.
B2B 7-day conversion rates sit around 2.5%. B2C sits at 15-18% in the first 7 days. By day 14, both drop to approximately 1%. This timeframe quickly passes.
What This Means for Your Onboarding
Your onboarding sequence needs to deliver value in days, not weeks. If your product requires 5 days of setup before showing anything meaningful, most users will be gone before they see it.
Longer trials don’t fix this. A 30-day trial with the same slow onboarding simply extends the period of non-use rather than providing more conversion opportunity. What changes behavior is faster time-to-value rather than extending the trial.
One tactic that works: reserve trial extensions for genuinely engaged users. If someone logs in daily and uses core features but hasn’t upgraded, an extra week can tip them. If someone hasn’t logged in since day 1, more time solves nothing.
How to Track Trial-to-Paid Conversion
Most teams track one number: the percentage of trials that converted. That’s not enough.
You need three separate rates. Visitor-to-trial signup tells you how effective your acquisition is. Trial-to-activation (first meaningful action) tells you whether users find value. Activation-to-paid tells you whether that value translates into willingness to pay. A problem in any one of these shows up as a low overall conversion rate, but the fix is completely different depending on where it actually lives.
Metrics That Matter
- Trial activation rate: the percentage of signups who take a meaningful first action beyond just logging in
- Time-to-first-value: how long before a new user reaches their first success in your product
- Day 3 and day 7 re-engagement: are users returning before the trial ends?
- Feature adoption by cohort: which features correlate most strongly with conversion?
- Conversion by acquisition channel: organic converts at higher rates than paid; measure them separately
Tools That Work
A recent survey of 200 products found the most-used conversion tracking tools are Mixpanel, Amplitude, Google Analytics, and ChartMogul. Teams looking to expand their stack: Pulseahead, PostHog, HubSpot, and Statsig are high-value additions.
The specific tool matters less than choosing one that tracks behavioral events beyond simple page views and allows cohort segmentation by signup date, channel, and engagement level.
To improve trial to paid conversion, it is important to understand why they left in addition to what they did. To collect and act on feedback from trial users, you need an in-product feedback layer. Pulseahead includes an Early Activation Confidence survey that fires at 48 hours to catch uncertainty before it becomes churn, plus an Onboarding Experience survey to surface setup friction your usage data misses. Combined, they provide the qualitative signals needed to fix what your analytics flag.
See why trial users don't upgrade. Fix it fast.
What High-Converting Teams Do Differently
Optimizing first-hour activation is their priority. Top performers get users to a meaningful completed action in under 24 hours. Not a product tour. An actual result. Slack optimized onboarding around teams reaching 2,000 messages, because that threshold correlated with retention. Zapier gets you to your first automation in minutes. The goal is making the product feel essential before the trial ends, not after.
At signup, these companies segment users. Instead of one onboarding flow, they ask two or three qualifying questions. Personal or team? Speed or features? These answers route users to relevant examples and defaults. Users see an onboarding path built for their use case, not a generic walk-through of every feature.
Instead of using trial days, emails are tied to behavior. A user who hasn’t logged in by day 2 gets a different email than one who logged in but didn’t complete a core task. Behavior-based sequences address what the user actually did, not what day they’re on. The improvement in conversion compared to time-based sequences is significant.
Friction is removed from the upgrade path. One company removed 3 fields from its payment page and increased conversions by 8%. The moment a user decides to upgrade, nothing should slow them down. Auto-fill available information and minimize steps to make the decision feel effortless.
Automating the Trial-to-Paid Flow
Behavioral triggers outperform time-based sequences by roughly 4x in conversion rate and 74% in open rates across multiple independent data sources. The shift from calendar-based drips to per-user decision flows is covered in full - including the rules engine, activation milestone identification, tool stack, and what changes in regulated markets - in the dedicated guide: Decision Automation for Trial-to-Paid Conversion Flows.
Diagnosing Your Specific Leaks
The most useful thing to do once you have aggregate conversion metrics is ask users directly. An in-product survey at trial end, specifically “What’s preventing you from upgrading?”, gets at the actual reasons: pricing, missing features, complexity, or a lack of perceived benefit they can’t otherwise articulate. A Trial-to-Paid Conversion Survey built in Pulseahead gives you this without a separate research effort.
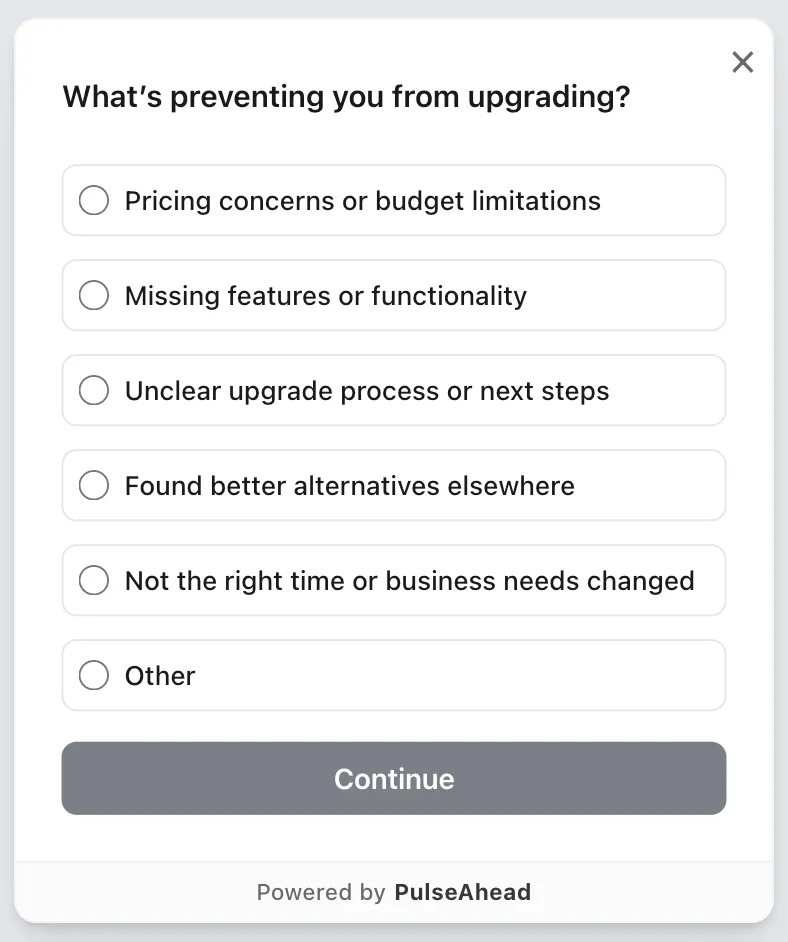
Trial to Paid Conversion Survey Example using Pulseahead
Exit-intent surveys often produce more honest responses. Users who are actively about to leave have less reason to be polite. If 40% of responses point to pricing, test a tiered option. If 30% mention integration problems, that’s a product gap. If 20% didn’t understand the value, your messaging is failing rather than your product.
Session recordings of users who abandoned in week one add behavioral context. Watch 20-30 sessions. Note where users pause, where they backtrack, where confusion appears. It’s cheaper than a usability study and often more revealing.
If you’re running in-product surveys during trials, trigger them at moments of natural friction instead of waiting until the trial ends. A user who hits a confusing step on day 2 gives better diagnostic information than one surveyed a week later about a frustration they’ve already half-forgotten.
Frequently Asked Questions
What is the SaaS free trial to paid conversion rate benchmark?
The most widely cited number is 8.9% for opt-in trials (no credit card required), based on ChartMogul's 2026 study of 200 products. But this applies to one model only. Opt-out trials (CC required) average 31.4%. Freemium products average 5.6%. Your relevant benchmark depends on which model you're running rather than on a single industry-wide number.
Is 18% a good SaaS free trial conversion rate?
For opt-in trials, 18% is an excellent rate. According to 2026 data, the 75th percentile for opt-in trials is 10-15%, making 18% well above the "great" threshold. However, if you're running an opt-out (CC-required) model and seeing 18%, that signals a meaningful problem, as the average for that model is 31.4% and the 50th percentile starts at 25%.
What's a good B2B SaaS free trial conversion rate?
For an opt-in trial, 4-6% is a good (50th percentile) rate, and 10-15% is great (75th percentile), based on 2026 data. For an opt-out (CC required) model, 25-35% is good, and 50-60% is great. These percentiles give you a realistic target based on how actual products perform today, so factor in your specific model rather than aiming for an arbitrary high number.
How do trial conversion rates affect SaaS revenue?
A 1 percentage point improvement in free-to-paid conversion produces roughly 15% more new revenue per trial cohort, per ChartMogul's 2026 analysis of 200 B2B products. Because conversion improvements benefit every future cohort, the effect compounds in a way a one-time acquisition campaign doesn't. Going from 5% to 10% conversion doubles your revenue from the same volume of signups, without changing acquisition spend.
How do I track trial-to-paid conversion correctly?
Track three rates instead of just one: visitor-to-trial signup, trial-to-activation (first meaningful action), and activation-to-paid. Most conversion problems are actually activation problems, and that's invisible if you only measure the aggregate. For tools: Mixpanel and Amplitude are the most commonly used for behavioral event tracking; ChartMogul for revenue attribution; PostHog and Statsig for experimentation and cohort analysis.
What's the difference between opt-in and opt-out free trial conversion rates?
Opt-in (no CC required) averages an 8.9% signup-to-paid rate and draws 4.5% of website visitors into the trial. Opt-out (CC required) averages a much higher 31.4% backend conversion, though it draws a lower 3.5% of visitors to sign up. The net outcome strongly favors CC-required: it generates about 11.0 paying customers per 1,000 visitors compared to just 4.0 for opt-in. However, this model only works if your brand and perceived value justify asking for a card before users have experienced the product.
How can I automate my trial-to-paid conversion flow?
Build behavioral triggers instead of time-based ones. Non-activation within 48 hours should fire a specific re-engagement message based on what the user did (or skipped), instead of a generic "getting started" email. Engagement with a paid-only feature should surface an in-context upgrade prompt at that moment. Heavy engagement without conversion should trigger a trial extension offer. For a complete breakdown of the rules engine, activation milestones, tool stack, and what changes in regulated markets, see the dedicated guide on decision automation for trial-to-paid conversion flows.
What's the average free trial conversion rate for B2C SaaS?
B2C free trials average 57%. Netflix converts at 93%; Amazon Prime Video at 73%. B2C benefits from individual decisions, low price points, and personal payment methods. These numbers don't apply to B2B products where purchase requires budget approval and multiple stakeholders. If you're building B2B, use B2B benchmarks exclusively.
How do I run a benchmark analysis on my own trial conversion data?
Segment before you benchmark. Break down your conversion rate by acquisition channel (organic vs. paid), signup cohort (weekly or monthly), user persona, and trial length. Compare like segments against each other first. Identify which segments convert best, then build your onboarding and follow-up sequences to replicate the conditions that made those segments succeed. Generic benchmarks give you a reference point. Your own cohort data tells you what to actually fix.
Skip the guesswork. Start with ready-made Pulseahead templates.