Getting customer satisfaction right feels impossible. You send surveys. You get responses. You build dashboards. Yet somehow, your team still struggles to figure out what customers actually need. Sound familiar?
The problem isn’t that you’re not trying. It’s that most product teams are measuring satisfaction wrong. They’re chasing scores instead of understanding the behavior behind those scores. And when you finally act on feedback, you discover it was too late. Customers already left.
Here’s what we’re covering: what a Customer Satisfaction Index actually is, why the tools most teams use fall short, the real pain points teams face when implementing it, and how to measure satisfaction in a way that actually drives retention and growth.
What Is a Customer Satisfaction Index? The Basics
The Customer Satisfaction Index (CSI) is a quantitative measure that tells you how happy customers are with your product, service, or a specific interaction. It’s typically calculated through surveys where customers rate their satisfaction on a scale (usually 1 to 5 or 1 to 10), and then you aggregate those responses into a single score.
But here’s where people get confused. CSI isn’t one metric. It’s an umbrella term for multiple ways to measure satisfaction:
CSAT (Customer Satisfaction Score): Measures satisfaction after a specific interaction. “How satisfied were you with your support experience?” This gives you a snapshot of whether that one moment went well. It’s transaction-based, not relationship-based.
NPS (Net Promoter Score): Measures loyalty and likelihood to recommend. “How likely are you to recommend us to a friend on a scale of 0 to 10?” People who score 9-10 are promoters, 0-6 are detractors, and 7-8 are neutral. Your NPS is calculated by subtracting detractors from promoters.
CES (Customer Effort Score): Measures how easy an interaction was. “The company made it easy to handle my issue.” This focuses on friction points in your customer journey. A low effort experience leads to loyalty. A high effort one drives customers away.
These three metrics each answer different questions. And here’s the thing most teams miss: you need all three to get the real picture. A customer can be satisfied with one interaction but hate your product overall. They can find something easy to use but have no intention of recommending you. Scores are only part of the story.
Why Teams Struggle With CSI in Practice
The research is clear. From Reddit discussions to customer success forums, product teams face similar problems when trying to implement satisfaction measurement:
Survey Fatigue Is Real: When you send too many surveys, customers stop responding. Response rates drop. Your sample sizes shrink. And now that small dataset is supposed to represent your entire user base. Support teams get flooded with survey responses to manage. Suddenly you’ve created work instead of insight.
Your Metrics Aren’t Connected to Business Outcomes: Here’s a painful truth: teams measure CSAT or NPS but can’t link these scores to actual retention or revenue. A customer might give you a 5 out of 5 satisfaction score but still churn six months later. Why? Because your satisfaction metric was measuring the wrong thing. You asked about their support experience when what actually mattered was whether they were adopting your core features.
Data Ends Up in Silos: You collect feedback in multiple places. Some through email surveys. Some through in-app feedback. Some through support conversations. These live in different systems. Your CRM doesn’t talk to your analytics tool. So while you have data, you can’t actually see the full picture of each customer.
What People Say Doesn’t Match What They Do: People tell you they love your product and then disappear. Or they complain about something that barely impacts their actual usage. Research shows that behavioral data (what users actually do) often tells a very different story than survey data (what users say). The best teams combine both signals instead of relying on one or the other.
Small Sample Sizes Make Scores Unreliable: Customer success teams have pointed out that metrics like CSAT and NPS based on too small a sample size become unreliable. You can’t make confident decisions on data that represents only 5% of your user base.
The core issue? Most teams are treating CSI as a dashboard metric to report upward instead of a lever to improve retention and drive growth.
How to Actually Measure Satisfaction (Without the Headaches)
Stop trying to measure everything at once. Start with this framework:
Step 1: Pick the Right Moments
Don’t survey at random. Survey right after critical moments in the customer journey. After they complete onboarding. Right when they try a new feature. Immediately after support interaction. The fresher the experience, the more honest the feedback.
This is where tools like Pulseahead’s CSAT surveys help. You set up the survey to trigger at the exact moment someone completes an action. They rate their experience while it’s still fresh. No delayed feedback weeks later when memories are fuzzy.
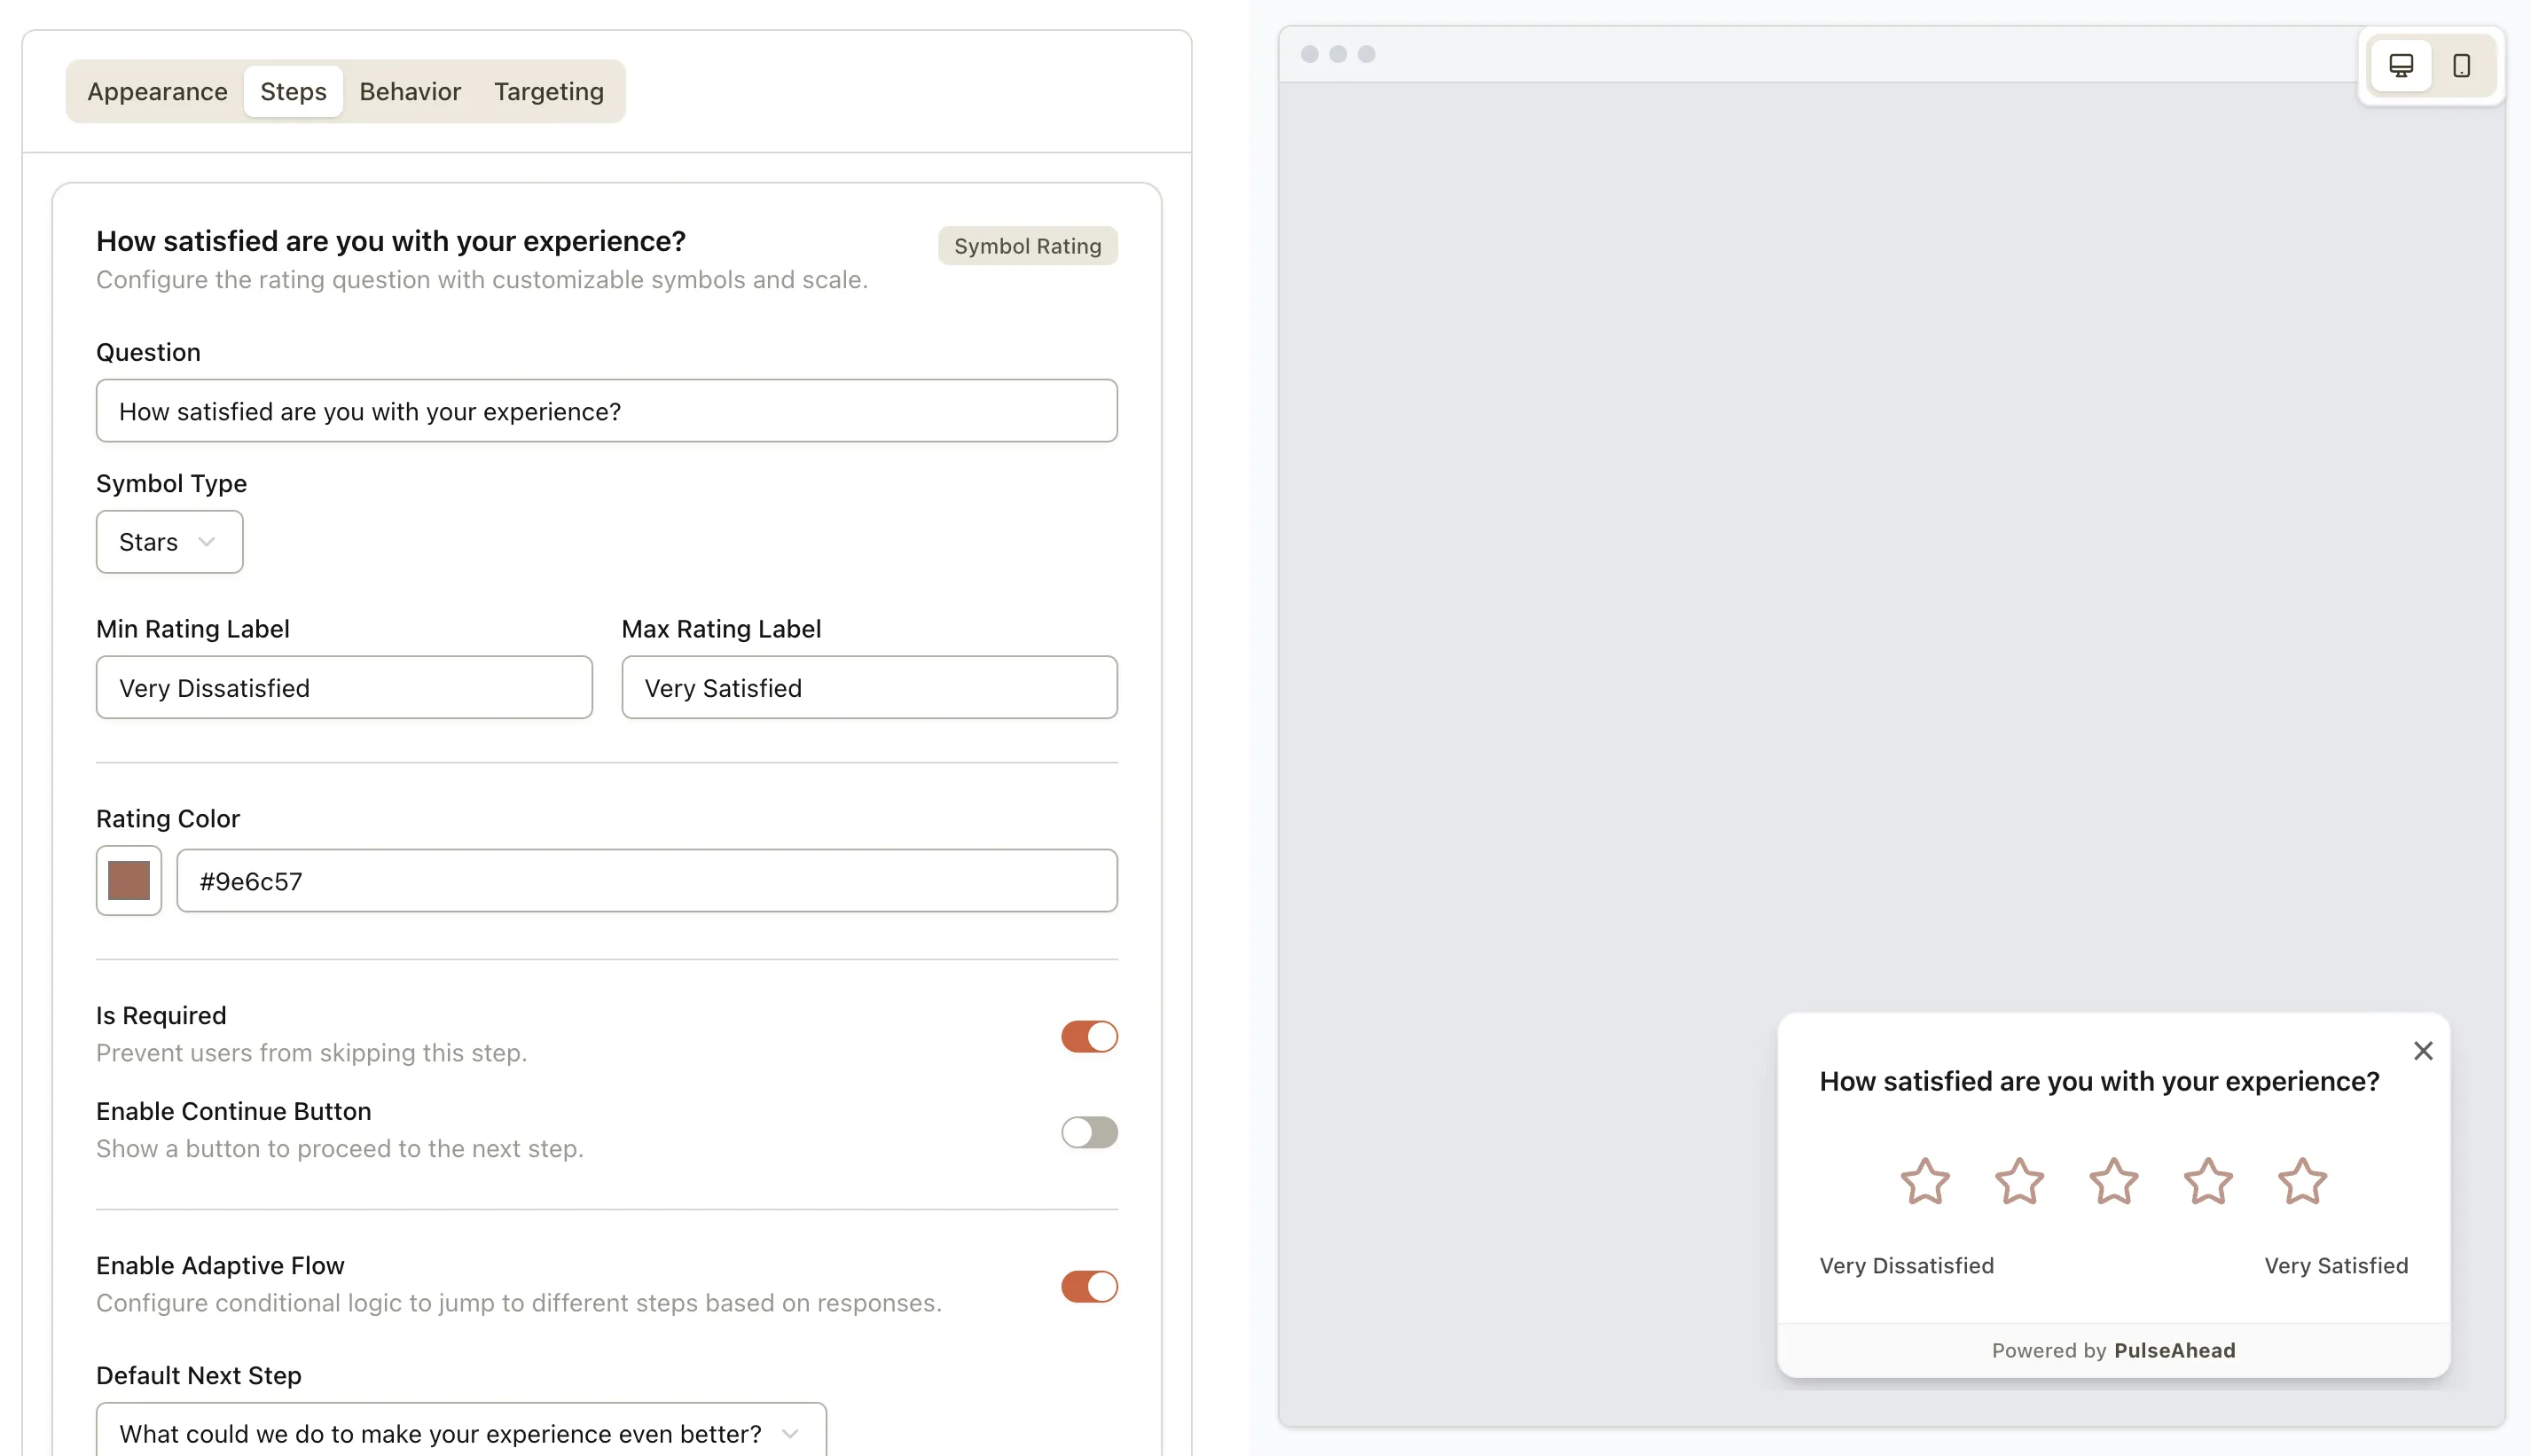
Building a CSAT survey in Pulseahead is straightforward and intuitive.
Step 2: Ask Fewer Questions
CSAT should be two questions: “How satisfied were you?” and “Why?” A rating without context is useless. Context without understanding where to improve is equally useless.
Keep follow-up questions tied to the score. If someone rates satisfaction at 1-2, ask specifically what went wrong. If they rate it 4-5, ask what went right. This adaptive approach gets you deeper insights without turning your survey into a homework assignment. With a tool like Pulseahead, you can use adaptive survey flows to dynamically change questions based on user responses, ensuring you get the most relevant information without overwhelming your customers.
Step 3: Combine Signals
Never rely on satisfaction scores alone. Look at:
What users actually do (feature adoption, login frequency, time to core value) What they tell you (survey scores, support tickets, community feedback) When they’re at risk (declining usage before churn, feature abandonment)
When you see low satisfaction scores AND declining usage, that’s your signal to act. When you see high satisfaction but low adoption, you have a communication problem, not a product problem.
Step 4: Track Everything in One Place
Fragmented data creates fragmented decisions. You need visibility into:
NPS trends over time to track loyalty CSAT by interaction type to find problem areas CES scores to identify friction points Open-ended feedback to surface the “why” behind scores
Step 5: Close the Loop
This is where most teams fail. They collect feedback and then ignore it.
When a customer gives low satisfaction, reach out to them personally. Tell them you’re fixing what they mentioned. Follow up to let them know it’s done. When satisfaction improves, celebrate that win with your team.
When customers report missing features, build that into your product roadmap communication. Show them you listened. This turns one survey into a retention tool.
The Metrics Framework That Actually Works
Here’s what a sustainable satisfaction measurement system looks like:
Measure NPS quarterly: Track long-term loyalty across your entire customer base. This is your health check. Declining NPS is an early warning signal. Check out our NPS survey template to get started.
Measure CSAT after every major interaction: Support tickets, feature onboarding, purchase, cancellation. Immediate feedback on specific moments. Our CSAT survey template is perfect for this.
Use CES to find friction: When customers report low CSAT, drill down with CES to understand if it’s about ease of use or something else entirely.
Segment your data: Satisfaction looks different by customer segment. Your highest-paying customers might rate support differently than trial users. Your power users have different satisfaction drivers than casual users.
Act on insights: For every survey you send, have a plan to act on the results. If you discover that onboarding is broken, don’t just note it. Fix it. Measure again. Show improvement.
Beyond Scores: Build a Feedback Loop
The most successful product teams aren’t doing traditional CSI. They’re building continuous feedback systems where customers tell them what matters, when it matters.
Instead of an annual survey, imagine this: Every time a user struggles with a feature, they have a simple in-product feedback button. They leave a comment. Your team sees it immediately. You categorize feedback by theme. You spot patterns in real time.
Pulseahead lets you set this up. Release feedback surveys to understand feature adoption. Exit surveys to understand churn. Onboarding surveys to catch problems before they become deal-breakers. Customer feedback templates for every stage of the journey.
The advantage? You’re not waiting for quarterly reviews or annual surveys. You’re collecting feedback when it’s most relevant, acting on it quickly, and measuring the impact of your changes. This proactive approach is what separates high-growth companies from the rest.
Skip the guesswork. Start with ready-made Pulseahead templates.
The Real Outcome: Why This Matters
Good satisfaction measurement leads to real business outcomes:
Customers who feel heard stay longer. CSAT improvements correlate with higher retention. Satisfaction isn’t fluffy. It’s directly tied to revenue.
Feature teams make better decisions. Instead of guessing which features matter, you see exactly what users want and what’s causing friction.
Support teams spend less time fighting fires. When you fix problems proactively based on feedback, support tickets drop.
Your churn rate stabilizes. Silent churn is devastating. The customers you don’t know are leaving are the hardest to win back. Exit surveys during cancellation give you one last chance to understand what went wrong.
Start Small, Measure Smart
You don’t need a complex CSI program. Start with this:
Pick one critical moment in your customer journey. Set up a CSAT survey. Collect 50 responses. Read the comments. Find the pattern. Act on it. Measure again.
That’s it. That’s the loop.
From there, you can expand. Add NPS to track loyalty. Add CES to measure specific interaction types. Build exit surveys to reduce churn. But start with one moment, one metric, one feedback loop.
The goal isn’t the score. The score is just a number. The goal is understanding your customers well enough to keep them happy, engaged, and growing with you. That’s what matters.
Happy customers stick around. Boost satisfaction with better feedback.